Aldgate SA

"They provided a very fast and efficient service they were at my home within the hour of my call and it wasn't even an..."
Get quotes from Bridgewater plumbers in three easy steps
Tell us what you need and we'll match you with local plumbers.
Receive free quotes and compare prices, reviews, and availability.
Choose the best plumber for your job based on reviews and price.
Word of Mouth plumbers in Bridgewater receive an average rating of 4.9 based off 37 reviews.
"They provided a very fast and efficient service they were at my home within the hour of my call and it wasn't even an..."
"They phoned me to tell me they were on their way and then arrived about 20 minutes later. This was during the..."
"Professional friendly group of plumbers. Able to handle what I would call tricky jobs. Always prompt in their service..."
"Had what we thought would be a simple job turn ugly and require a lot more work than expected. I held my breath and..."

"After being ripped off by another company, my Mum called Adam Plumbing. She had seen their mobile number on the side..."
"Mick came out to the property i am renting as i had a blocked toilet. He was so friendly and had such great service,..."
"Paul was responsive, honest, came on time, professional and reasonably priced. Will definitely use again! "

"Styleside Plumbing & Gas worked on our property and undertook work on our main drain, new gas lines, water lines and..."
"Very professional job, appreciated the advice to achieve best solutions, cared about doing an excellent job,..."
"best plumbing ive ever seen, fast well trained, and skilled"
"Lukas is one of those rare tradespeople you find that is so honest, friendly and does a fantastic job - and an all..."
"Fast response, I had my drain fixed on the same day. The price was great and the service friendly and efficient. I..."
"Responsive Plumbing and Gas was recommend to me by a neighbour after I had been ripped off by another business and my..."

"After calling many plumbers and not really get much of a response, saying maybe they could come out tomorrow and..."
"Mauro is a professional plumber and offers reliable service each visit/s. I found his work was always outstanding and..."
"The job was done cleanly and quickly. Boris was meticulous and as a result of the first seal in the en suite I..."
"In my opinion Plumbing Plus SA delivers great reliable services at a professional level. I found them to be friendly,..."
"We had 4 x 3000L rainwater tanks installed to collect rainwater off of the roof areas of our house as well as new..."
Showing 20 of 25 businesses
Market Intelligence
Data-driven insights based on 37 customer reviews collected between 2008 and 2025, ABS Census data
Bridgewater plumbers are rated 4.9 out of 5 stars — 0.3 stars above the South Australian average of 4.56, based on 37 customer reviews across 25 plumbers servicing the area.
With household income at $2,042/week (above the $1,748/week national median), you'd expect plumbers pricing in Bridgewater to run premium — but it actually lands 55% below the South Australian average, which means more room to get value here.
Over the 2008–2025 window, plumber ratings in Bridgewater have dropped from 5.0/5 to 4.4/5 — a signal to weight recent reviews more heavily than older ones. Review volume in Bridgewater runs lower than typical: 2.5 new plumber reviews per year, 71% under the South Australian average. The ratings here are based on a narrower sample and may respond more slowly to recent customer experience.
Based on customer-reported pricing on Word of Mouth, prices have risen 466% since 2015 (from $159 to $900 median), averaging 93.2% per year.
Based on 37 customer reviews collected on Word of Mouth between 2008–2025, and ABS Census 2021 data.
Based on Word of Mouth reviews 2008–2025
Based on customer-reported prices. Outliers removed.
How we calculate the Local Service Score: We combine two sources of data: first-party data collected directly by Word of Mouth — verified customer reviews, customer-reported pricing, post-service trust-signal responses, and service awards — with suburb-level population and housing data from the Australian Bureau of Statistics 2021 Census. The score measures how well Bridgewater is served for plumbers, reflecting the depth of choice, quality of service, and value for money available to residents compared to other suburbs across Australia. See our Local Service Score methodology for data sources, update frequency, and quality guardrails.
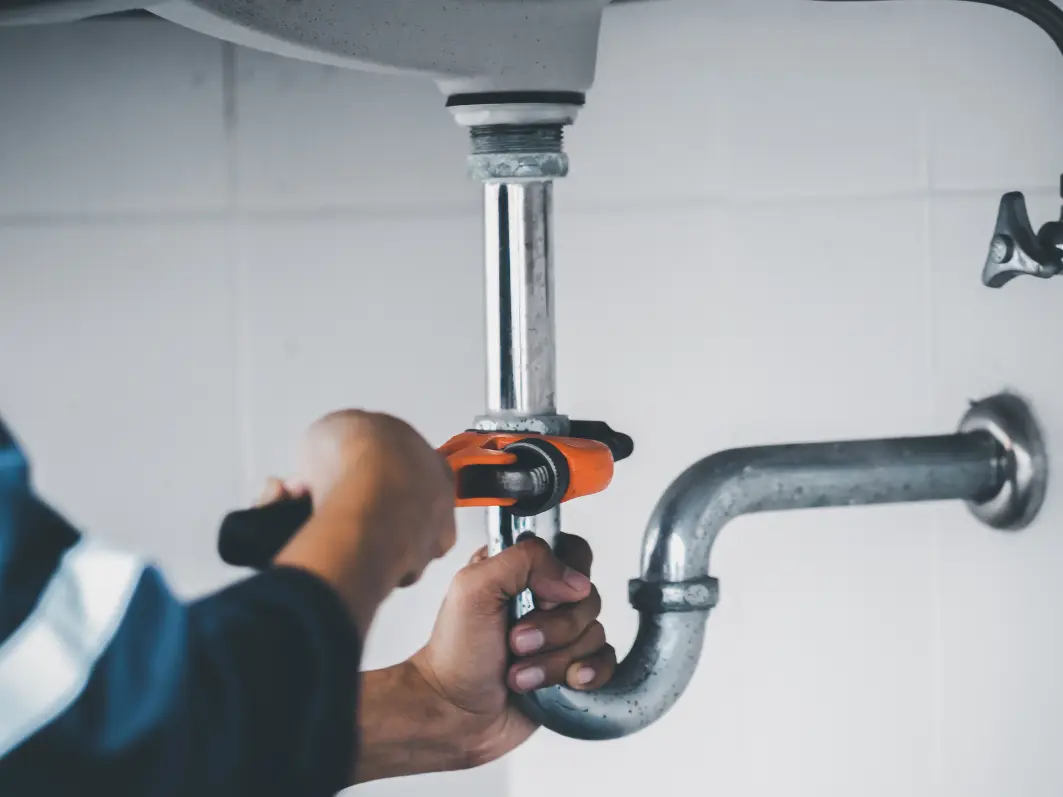
We connect you with qualified Bridgewater plumbers — not gig workers.
Get fast responses from local plumbers. Compare prices, reviews, and availability all in one place.
What you see is shaped by thousands of Aussies sharing their experiences over the past 18 years.
Browse our comprehensive cost guides to find the average national price for your job.
Start by comparing reviews from real customers — Bridgewater has 37 plumber reviews on Word of Mouth.
Plumbers in Bridgewater have an average rating of 4.9 out of 5 stars, based on 37 customer reviews on Word of Mouth. This is above the South Australian average of 4.56 stars.
With household income at $2,042/week (above the $1,748/week national median), you'd expect plumbers pricing in Bridgewater to run premium — but it actually lands 55% below the South Australian average, which means more room to get value here. For context, ABS Census 2021 data shows Bridgewater has 99% of dwellings are standalone houses, a median age of 40, a median household income of $2,042/week.