Alison NSW
"Brendan's quotes have been successful 0n 2 occassions we have had a new bathroom installed 2 years ago & just..."
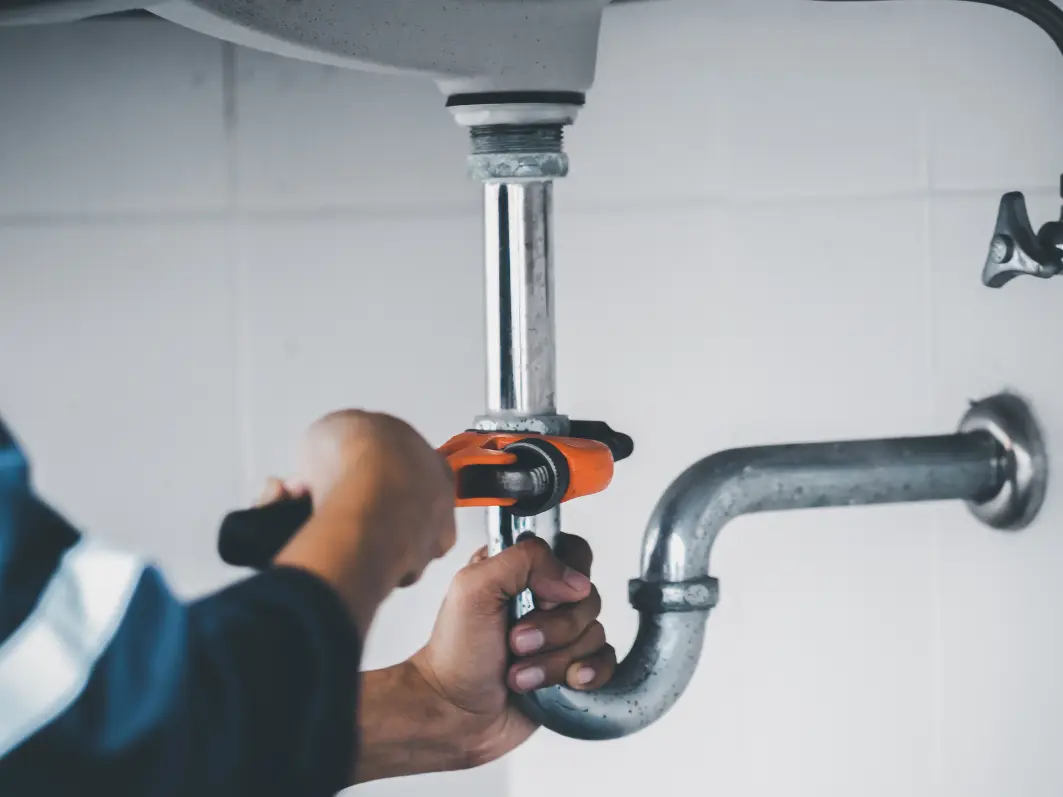
Get quotes from Warnervale plumbers in three easy steps
Tell us what you need and we'll match you with local plumbers.
Receive free quotes and compare prices, reviews, and availability.
Choose the best plumber for your job based on reviews and price.
Word of Mouth plumbers in Warnervale receive an average rating of 4.9 based off 49 reviews.
"Brendan's quotes have been successful 0n 2 occassions we have had a new bathroom installed 2 years ago & just..."

"Matt was awesome and incredibly detailed with his work. He provided me options to make it cheaper, and put me at ease..."
"Very professional, great prices and on time"

"I purchased the material for the plumber to come and do all the water pipes, though I ended up doing all the drainage..."
"Our Solar Hot Water tank was leaking and the roof panels were in the wrong position, giving us a bad Solar..."
"Al is brilliant! He returns phone calls, arrives on time and knows exactly what he is doing. I cannot recommend this..."
"I have called Luke to help with a couple of plumbing problems, and he has arrived when he said he would and fixed..."
"Easy to deal with, turned up on time and rates were reasonable. Wouldn't hesitate to recommend their services to others"
"Friendly,understanding, explains details well. Overall more than happy with service."
"Brett was on time and fixed my blocked sewerage pipe professionally and quickly . I was happy with his work , would..."
"Great plumber! Very reliable and he helped us sort out our plumbing problems (which were extensive!). Friendly,..."

"Quick and efficient service. We had a leaking tap and he came and replaced it quickly and neatly"
"The best renovation service I have ever encountered, if I could be this sure of having a project completed on time,..."
"Paul Frost has been very pleasant to deal with as we have been upgrading one of our bathrooms as well as having..."
"'Nicholas was the first to respond, quoted an acceptable price and carried out the job within the quoted timespan. I..."
Showing 20 of 25 businesses
Market Intelligence
Data-driven insights based on 49 customer reviews collected between 2008 and 2023, ABS Census data
Warnervale is one of the more affordable areas for plumbers — 31% below the NSW average. 25 plumbers service the area with 49 customer reviews.
Interesting pattern in Warnervale: income runs above the national median ($1,929/week vs $1,748/week) but local plumbers price 31% below the NSW average. Worth comparing quotes to take advantage of that.
Local plumber ratings have climbed from 4.6/5 (2008) to 4.9/5 (2023) — a clear quality improvement over the 15-year window. Review flow for plumbers in Warnervale is lighter than typical — 4.5 new reviews a year, 61% below the NSW average. Consider this when comparing local ratings to busier suburbs.
Based on 49 customer reviews collected on Word of Mouth between 2008–2023, and ABS Census 2021 data.
Based on Word of Mouth reviews 2008–2023
Based on customer-reported prices. Outliers removed.
How we calculate the Local Service Score: We combine two sources of data: first-party data collected directly by Word of Mouth — verified customer reviews, customer-reported pricing, post-service trust-signal responses, and service awards — with suburb-level population and housing data from the Australian Bureau of Statistics 2021 Census. The score measures how well Warnervale is served for plumbers, reflecting the depth of choice, quality of service, and value for money available to residents compared to other suburbs across Australia. See our Local Service Score methodology for data sources, update frequency, and quality guardrails.
We connect you with qualified Warnervale plumbers — not gig workers.
Get fast responses from local plumbers. Compare prices, reviews, and availability all in one place.
What you see is shaped by thousands of Aussies sharing their experiences over the past 18 years.
Browse our comprehensive cost guides to find the average national price for your job.
Start by comparing reviews from real customers — Warnervale has 49 plumber reviews on Word of Mouth. 1800HOTWTR (2016) has earned a Word of Mouth Service Award — an award that recognises consistently high customer ratings over a calendar year.
Plumbers in Warnervale have an average rating of 4.9 out of 5 stars, based on 49 customer reviews on Word of Mouth.
Interesting pattern in Warnervale: income runs above the national median ($1,929/week vs $1,748/week) but local plumbers price 31% below the NSW average. Worth comparing quotes to take advantage of that. For context, ABS Census 2021 data shows Warnervale has 96% of dwellings are standalone houses, a median age of 34, a median household income of $1,929/week.